
D3 Charts (Data-Driven Documents)

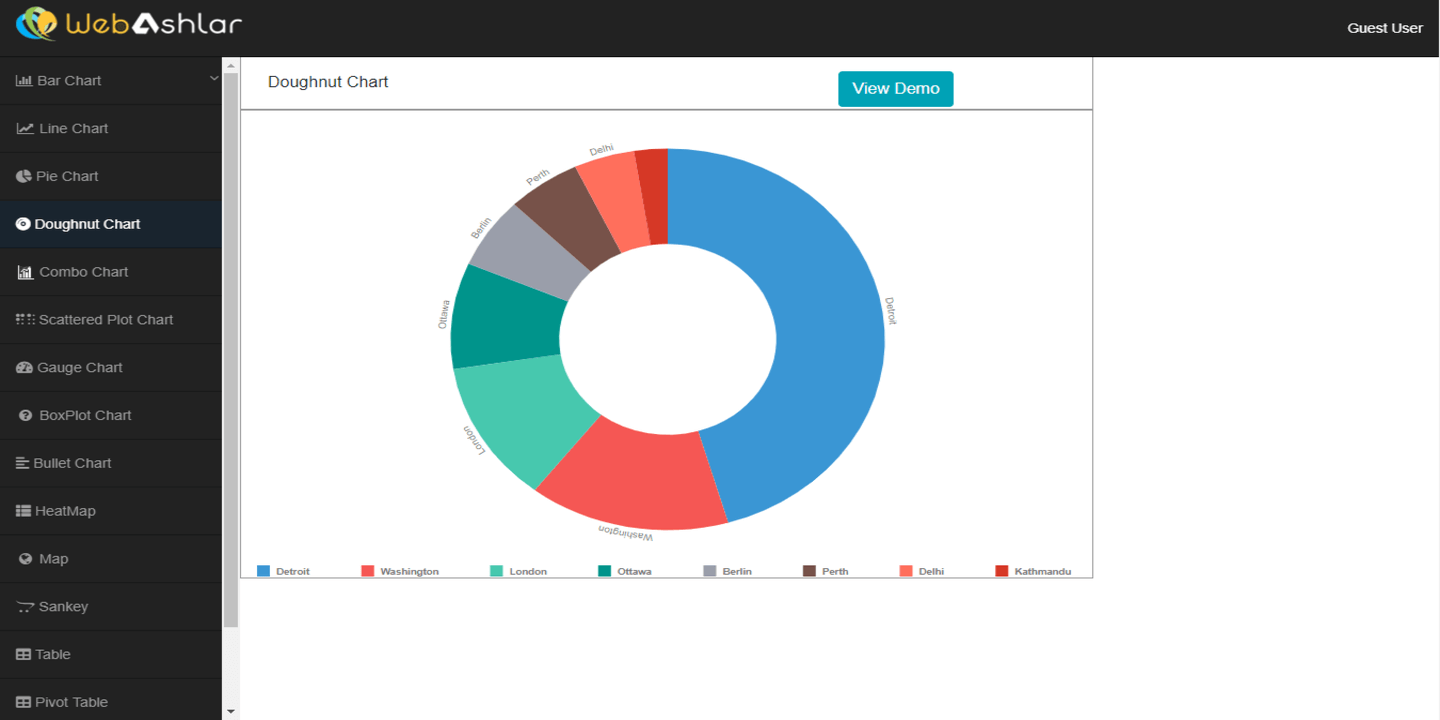
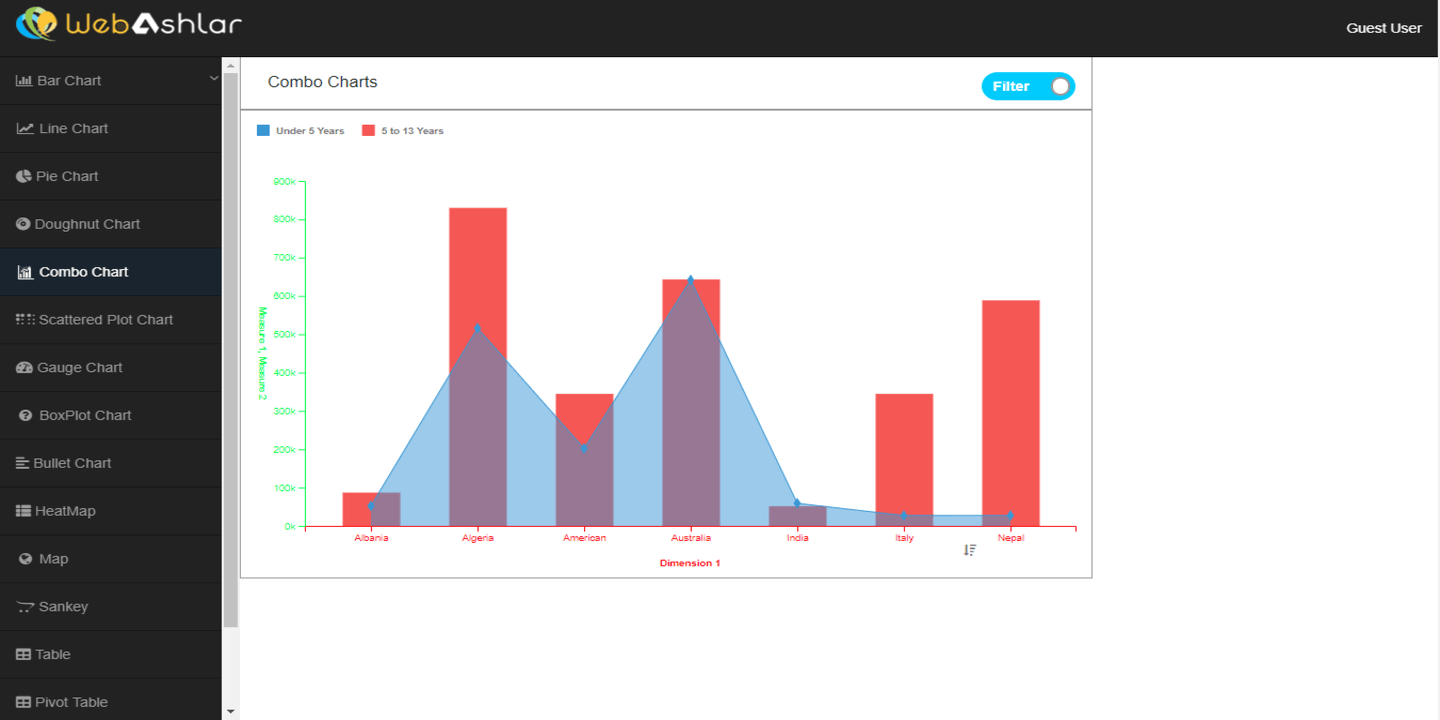
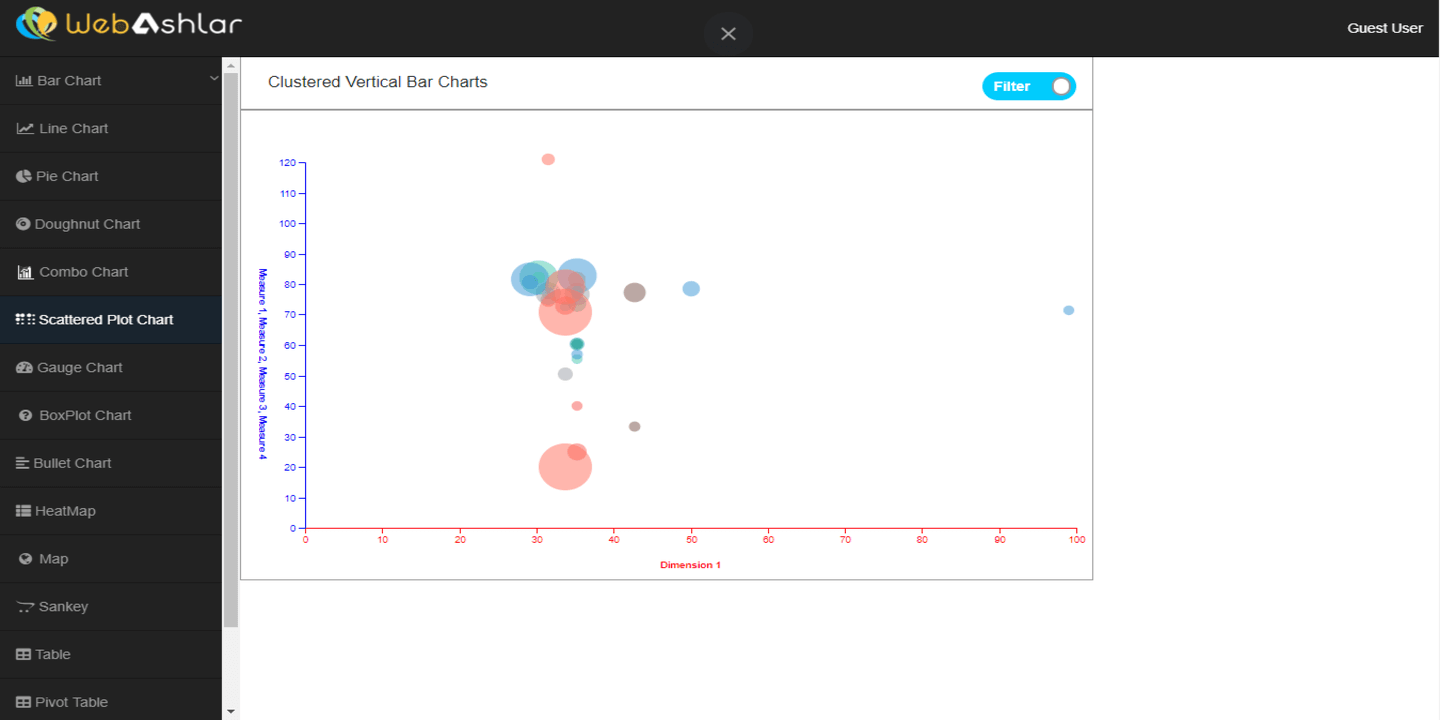
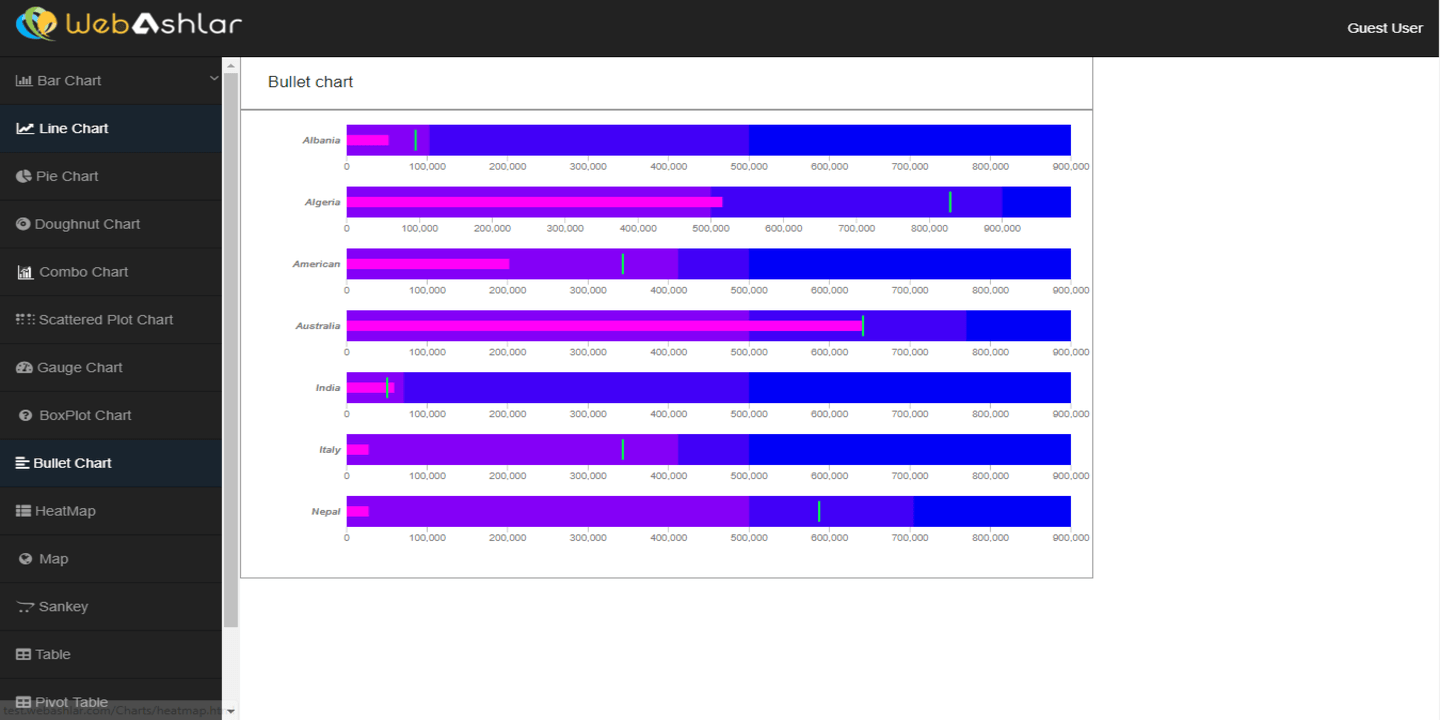
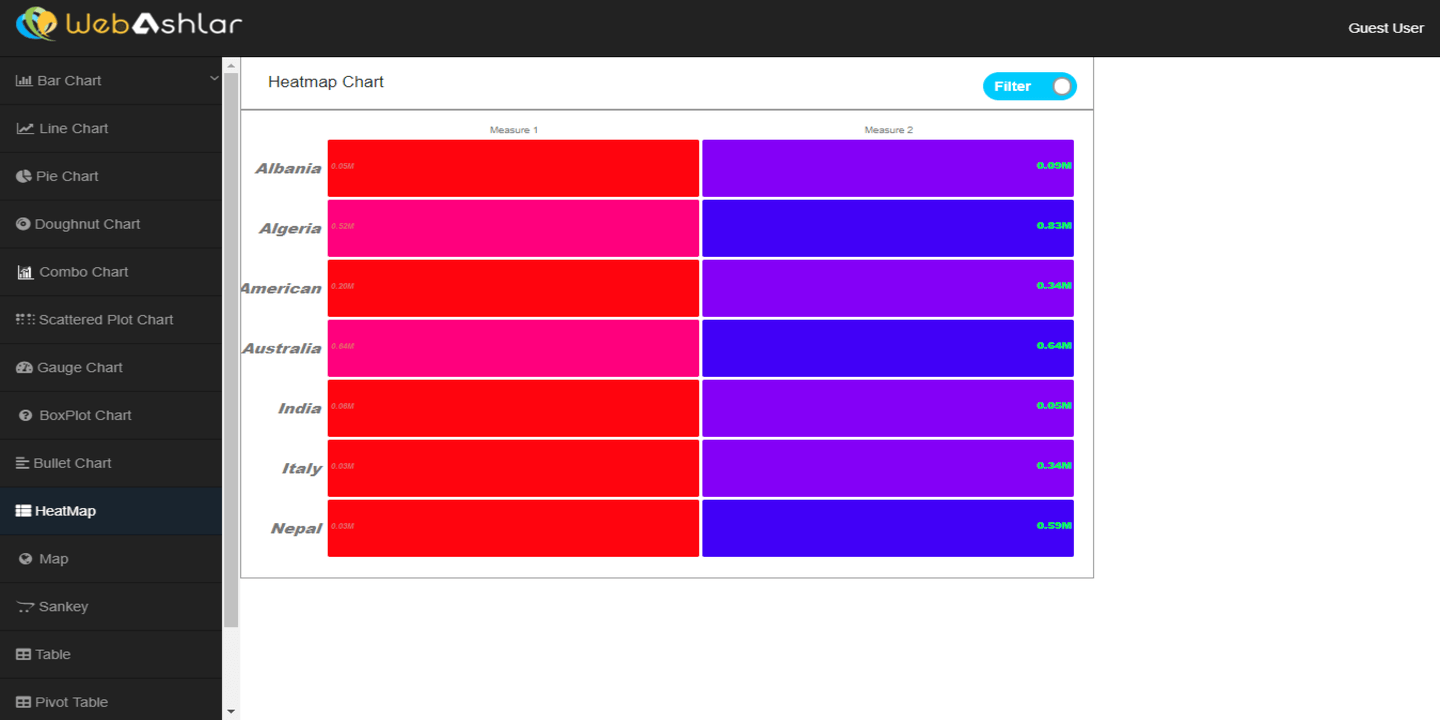
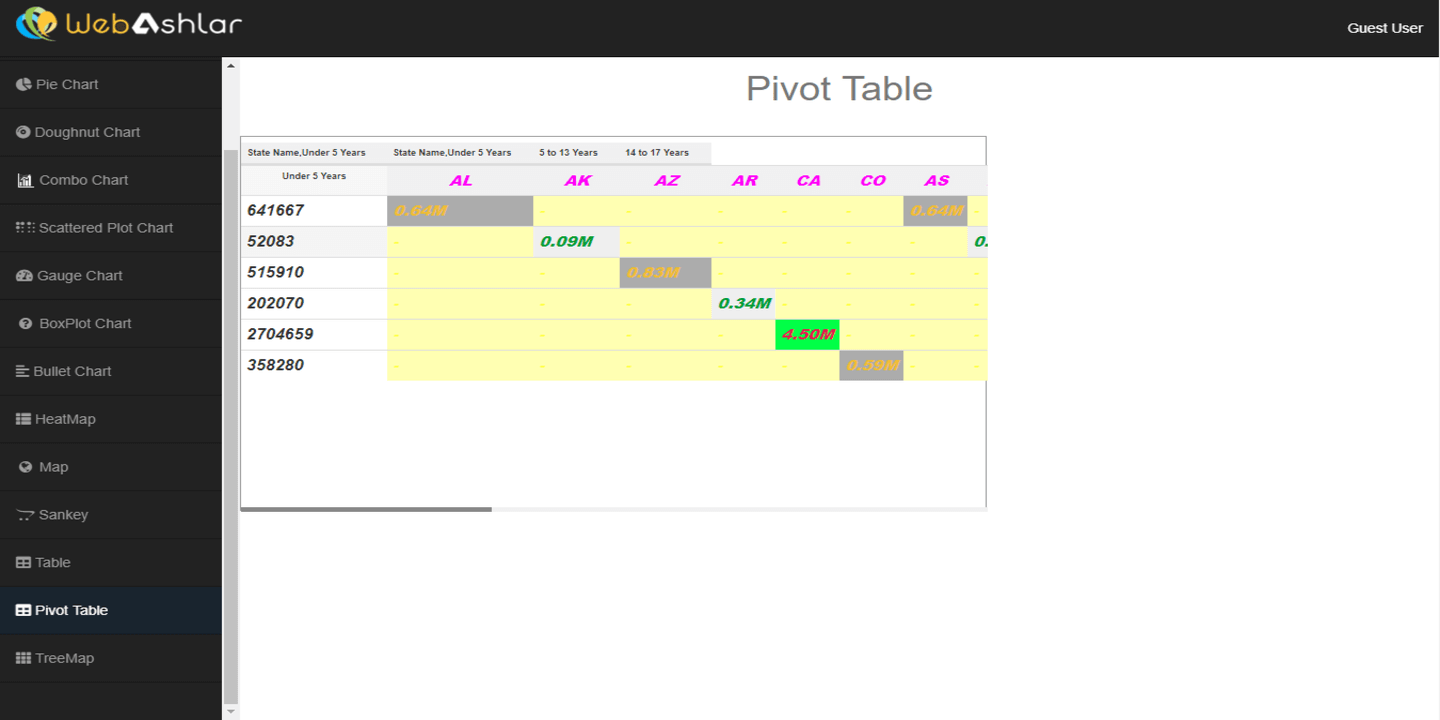
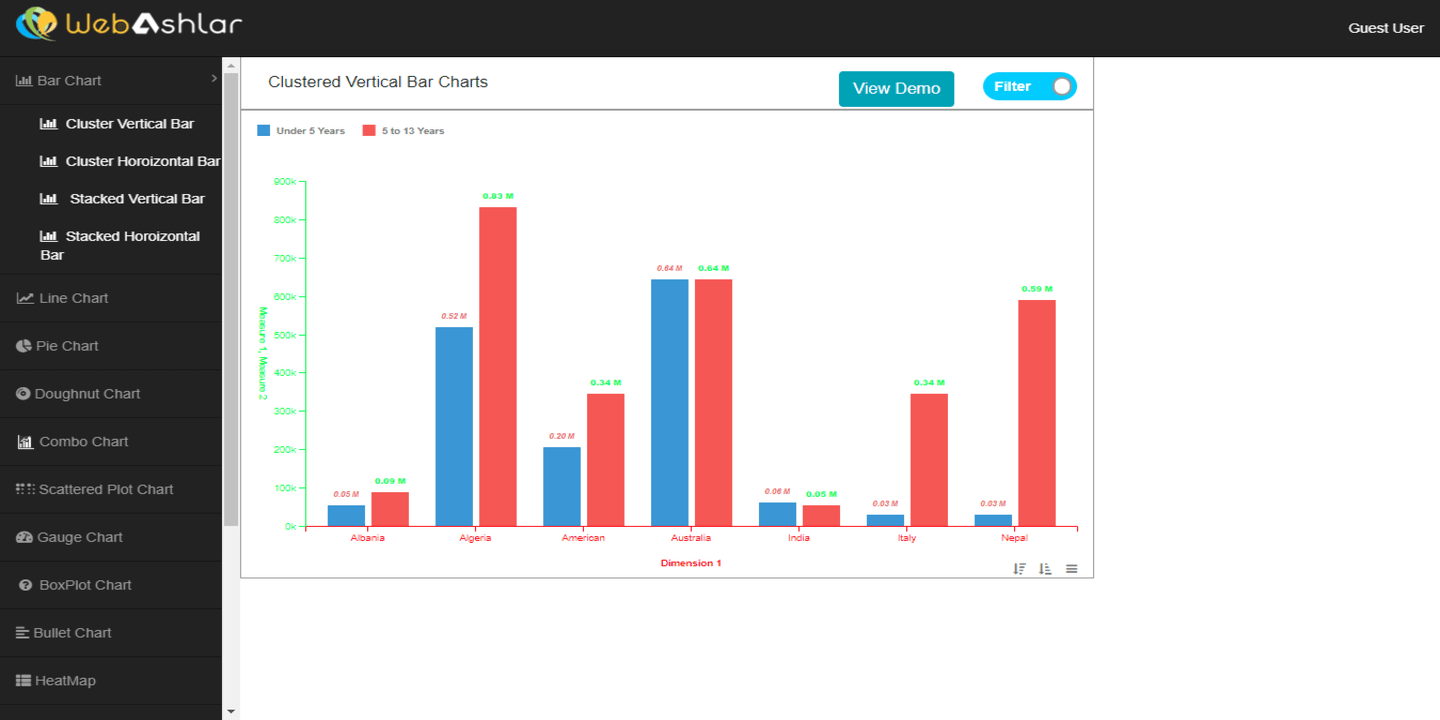
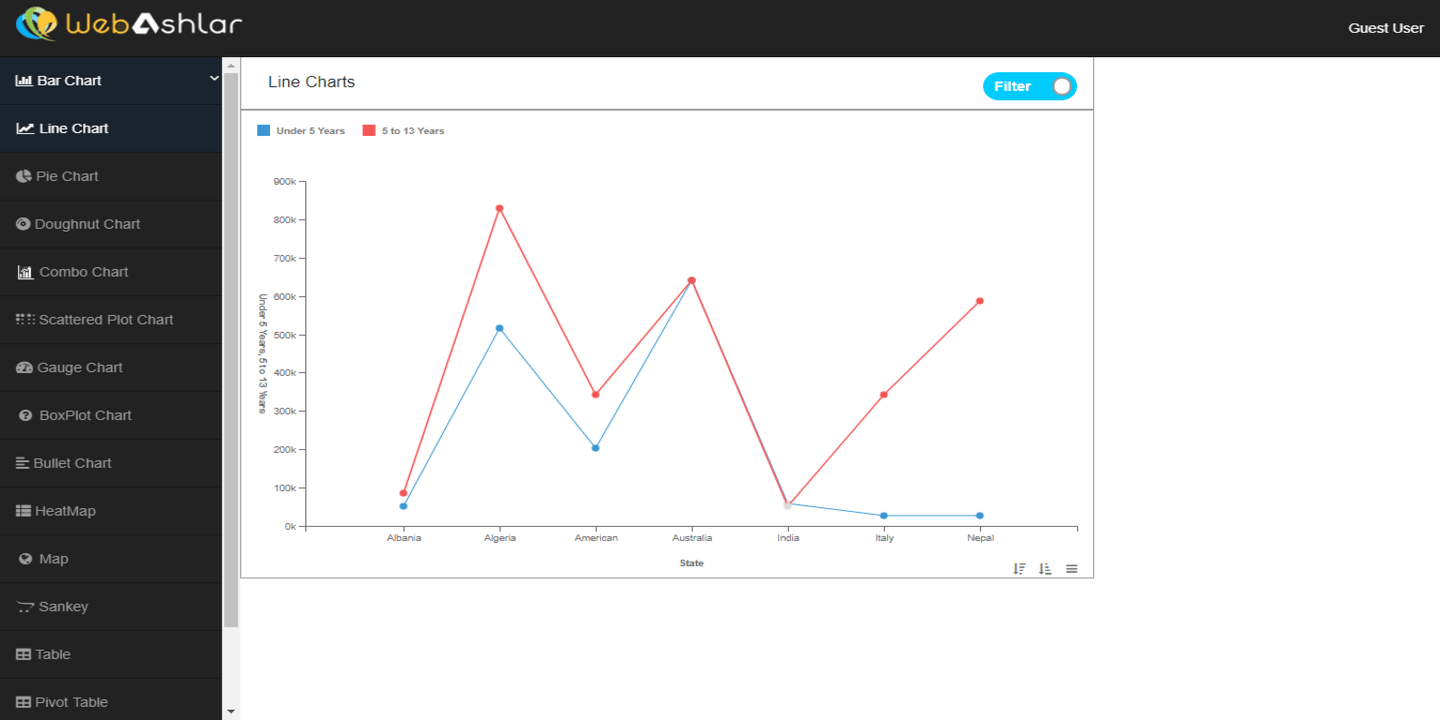
D3.js (or just D3 for Data-Driven Documents) is a JavaScript library for producing dynamic, interactive data visualizations in web browsers. It makes use of the widely implemented Scalable Vector Graphics (SVG), HTML5, and Cascading Style Sheets (CSS) standards. It is the successor to the earlier Protovis framework.