Power BI: Transforming Data into Actionable Insights

Industry
Visualization

Country
Armenia.

Team Size
10

Collobration
2012
About Visualization
Our Business Intelligence Dashboard offers powerful data visualization, transforming complex data into clear, actionable insights. By integrating key metrics like sales, traffic, and customer demographics, it enables real-time performance monitoring with interactive features like slicers and filters for a tailored, dynamic user experience.
Overview
The Business Intelligence Dashboard is a comprehensive data visualization platform designed to deliver actionable insights and streamline decision-making. By integrating diverse metrics such as sales, traffic, investments, and customer demographics, the dashboard empowers users to monitor and optimize their operations effectively. The platform includes interactive slicers, charts, and filters to provide a tailored and dynamic user experience, catering to business needs in real-time.
Challenges
Centralized Data Visualization: Aggregating data from multiple platforms and sources into an intuitive and accessible dashboard.
Dynamic Filtering and Analysis: Providing users with tools to filter, slice, and analyze data based on various parameters like time, product, and performance metrics.
Comprehensive Metrics Presentation: Balancing a large volume of metrics such as sales, refunds, investments, and demographics in a user-friendly layout.
Customization for Multiple Roles: Adapting the dashboard for different stakeholders (e.g., marketers, product managers, store operators) with role-specific views.
Solutions
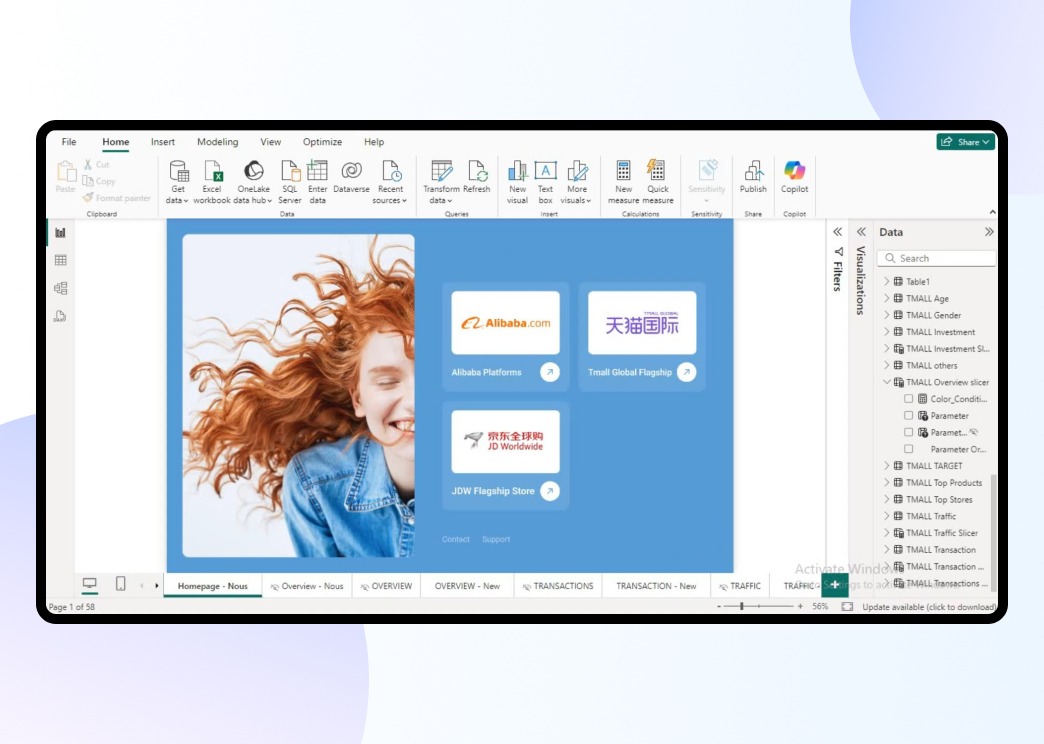
Interactive Home Page: Developed a homepage listing multiple platforms featuring various brands, acting as a central navigation hub.
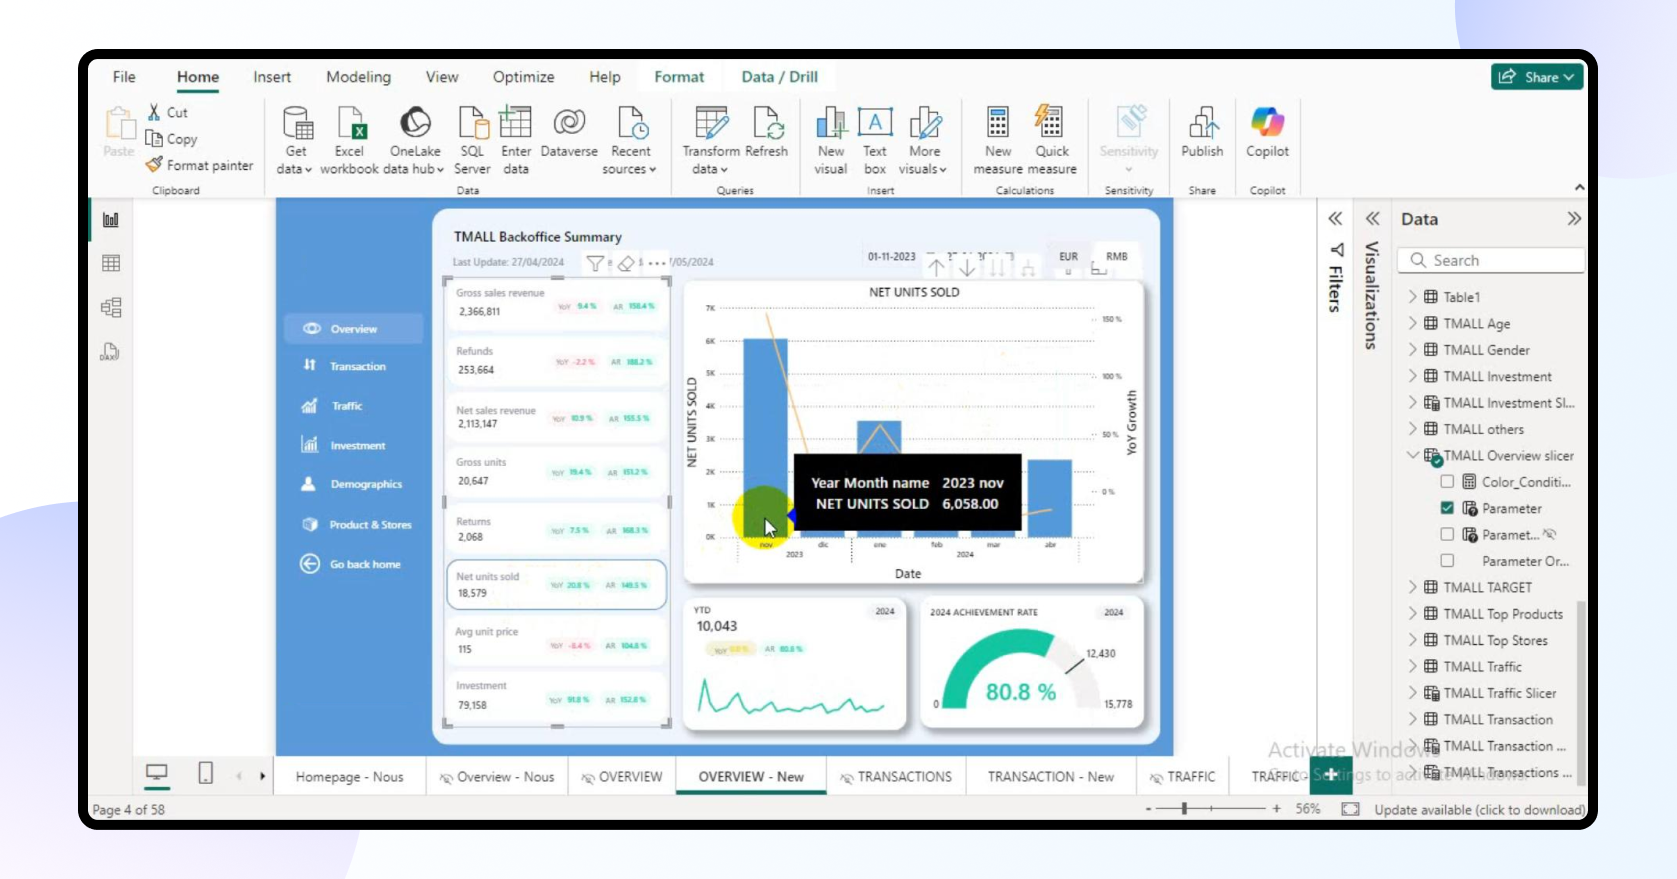
KPI-Driven Overview Page: Implemented a sidebar summarizing key performance indicators (KPIs) such as Refunds, Returns, Investments, and Gross Units, dynamically updated based on user selections and date filters.
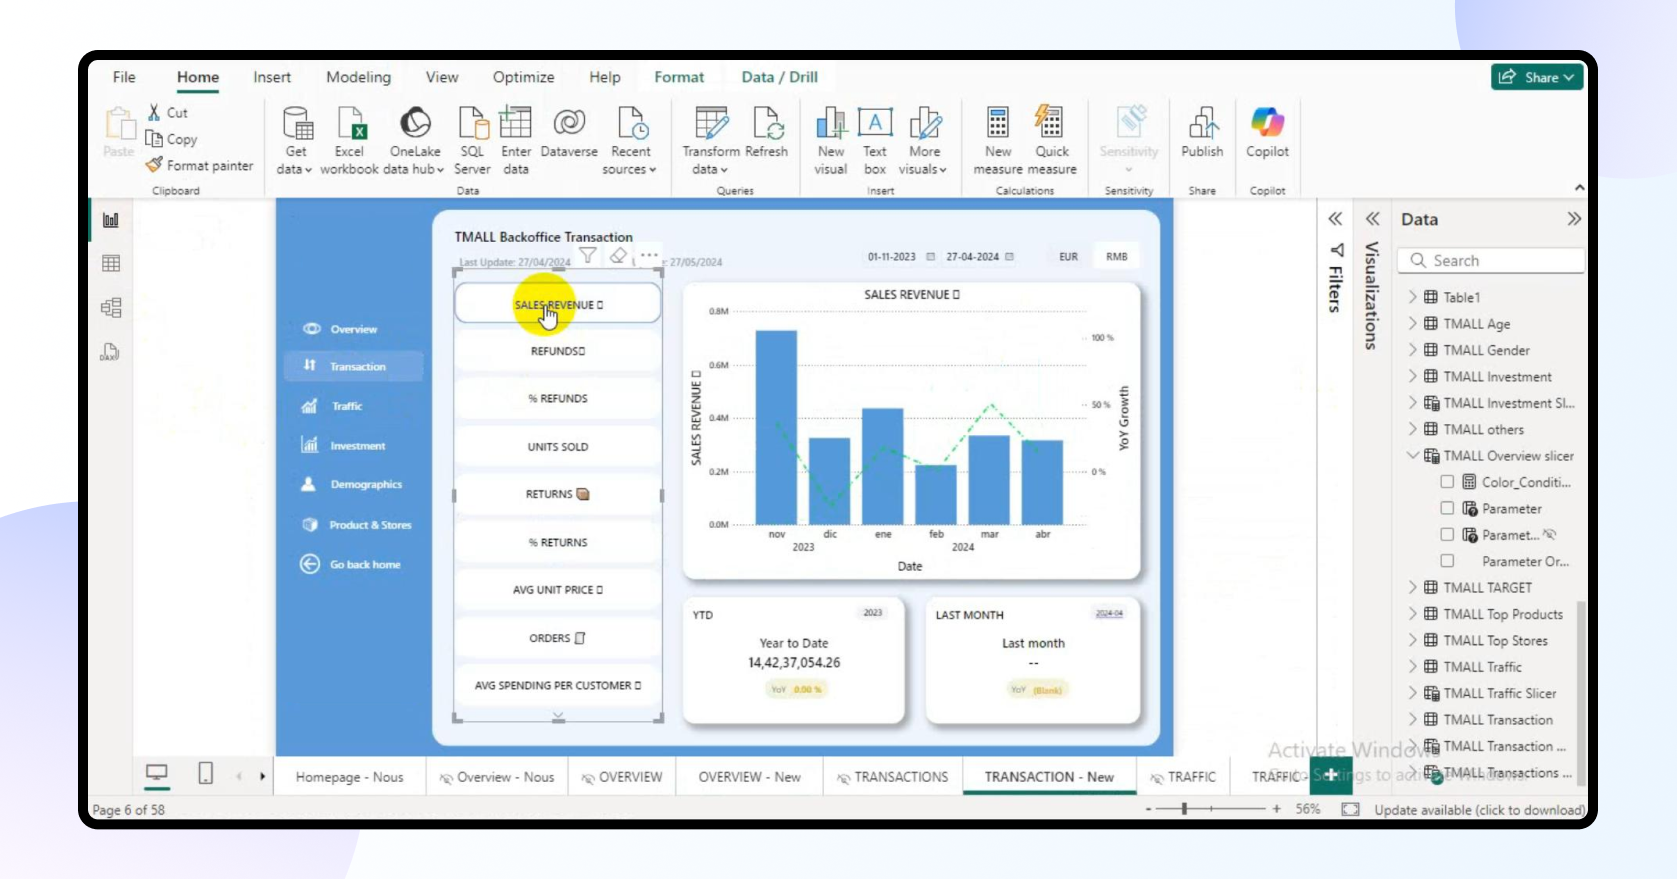
Transaction Analysis: Built a transaction page presenting metrics like Sales Revenue, Refunds, Average Unit Price, and Orders using a Line and Clustered Column chart for clear trend visualization.
Traffic Metrics Tracking: Created a traffic page to display Page Views, Visitors, and New Customer Transactions, enabling businesses to track user engagement.
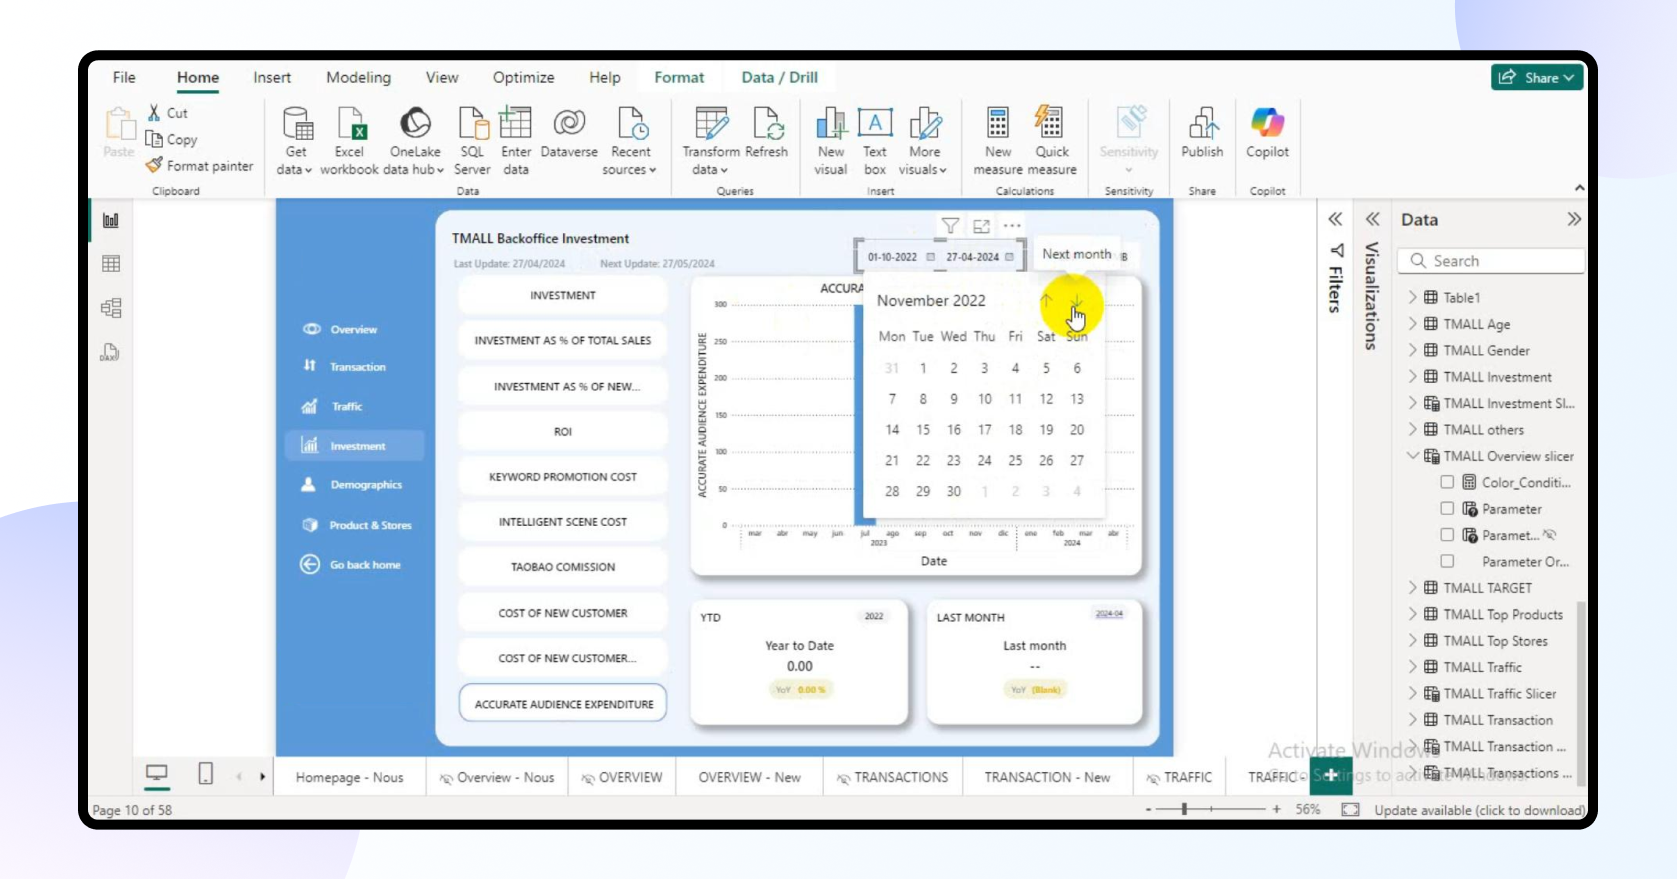
Investment Insights: Added an investment page to analyze metrics such as Investment, Cost of New Customers, and Keyword Promotion Cost, with filtering options based on charts and timeframes.
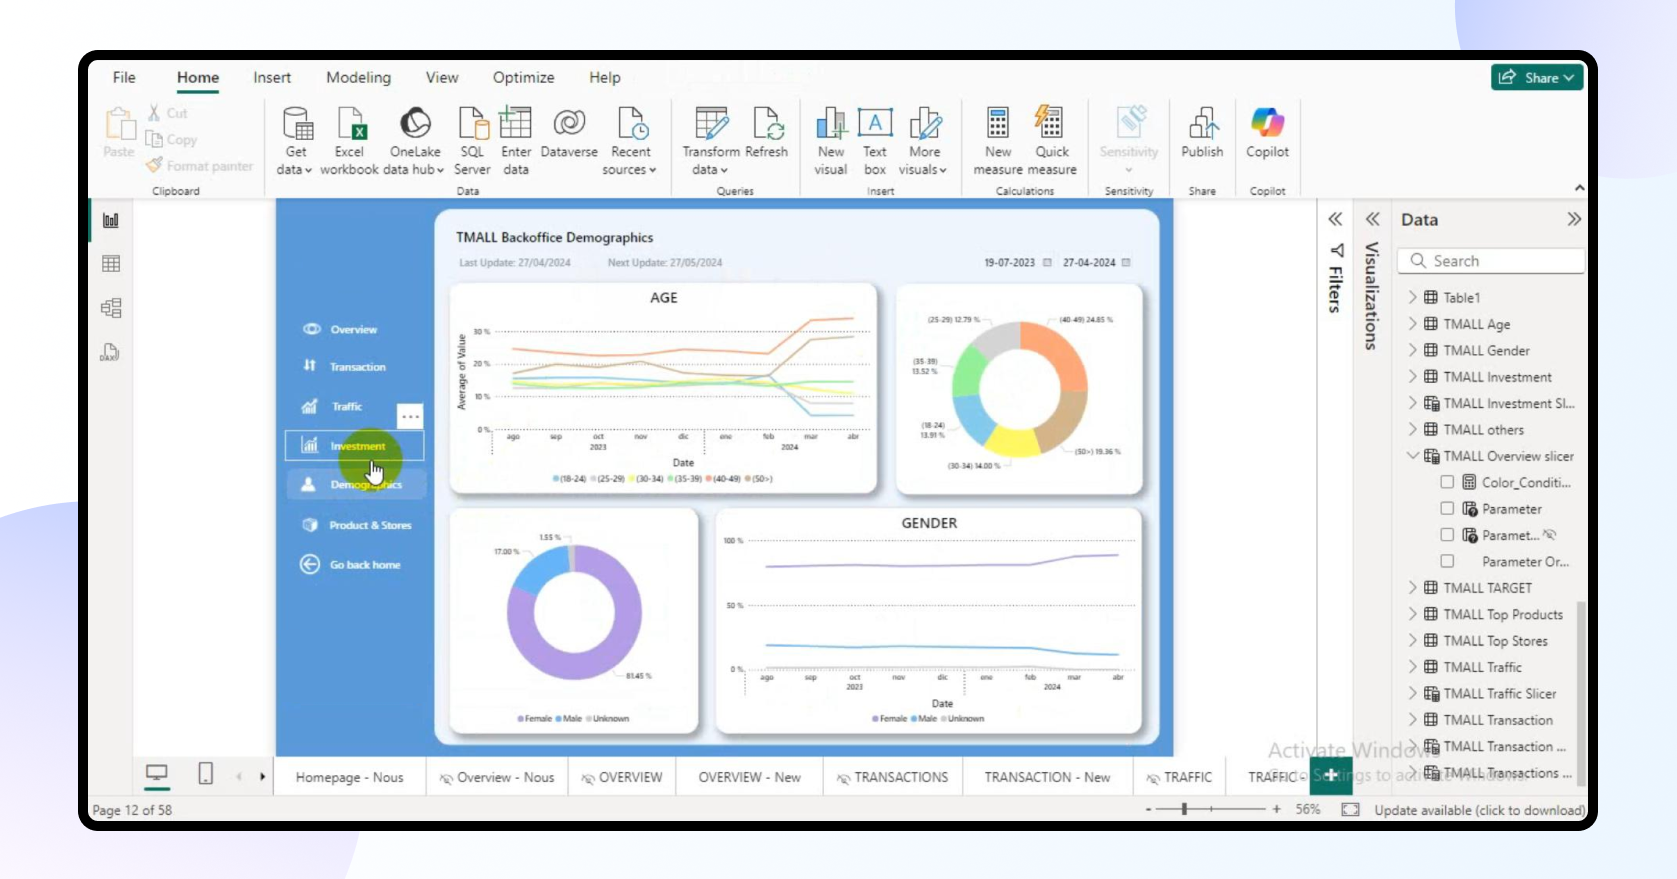
Demographics and Trends: Designed a demographics page with a Line chart for average age trends and a Donut chart for gender distribution.
Top Products and Stores: Developed a Product and Store page showcasing top-performing products and stores, using product and store bookmarks as well as year and month filters for tailored insights.
Results
Enhanced Operational Visibility: Provided a centralized and interactive platform for tracking and analyzing key metrics across different aspects of business performance.
Improved Decision-Making: Enabled stakeholders to make data-driven decisions using intuitive visualizations and dynamic filtering options.
Increased User Engagement: Delivered user-friendly navigation and interactive elements, improving accessibility for users of varying technical expertise.
Customizable and Scalable Designt: Built a flexible dashboard that could adapt to the growing needs of the client’s business and stakeholders.
Technology Stack
-

Backend
-

Integratio
-

Hosting