A Futuristic IoT Platform for the City of the Future

Industry
Data Visualization

Country
Dubai

Team Size
7

Collobration
2004
Data Visualization Project
Our Data Visualization Project turns complex data into intuitive, interactive visual stories. By utilizing advanced tools like charts, graphs, and dashboards, we help organizations unlock hidden insights and make informed, data-driven decisions. From real-time analytics to predictive modeling, our platform enhances clarity, improves decision-making, and drives actionable outcomes.

Overview
Neom IOT SENSE is a next-generation, standards-based horizontal IoT platform designed for Neom, a futuristic metropolis powered by cutting-edge technology and innovative urban solutions. The platform enables seamless connection, monitoring, and control of various devices, assets, and other IoT platforms. It leverages the power of interoperability, harmonized data sets, and advanced analytics to enhance sustainability, safety, and quality of life for its residents.
Challenges
1. Data Visualization:
Vast Dataset Management: Managing and presenting the influx of large datasets in a clear, real-time format to provide easy interpretation and actionable insights.
Real-Time Analysis: Ensuring that the platform can handle real-time analysis and alert generation, especially with complex data from various IoT sources.
2. Predictive Maintenance and Anomaly Detection:
Real-Time IoT Data Analysis: Implementing robust anomaly detection and predictive maintenance capabilities that operate in real time using proprietary AI-based algorithms.
Device Health Monitoring: Continuously monitoring the health and security of devices through real-time data analysis, data enrichment, and device fingerprinting.
3. Scalability and User Experience:
Scalable Infrastructure: Developing an infrastructure that can scale to accommodate the increasing volume of data as Neom grows.
User-Friendly Interfaces: Creating intuitive interfaces that allow even non-technical users to interact with and understand complex data.
Solutions
1. Advanced Data Analytics and Visualization:
Data Analytics Tools: Implemented advanced data analytics tools capable of handling and displaying large datasets effectively. This allows for in-depth analysis and actionable insights.
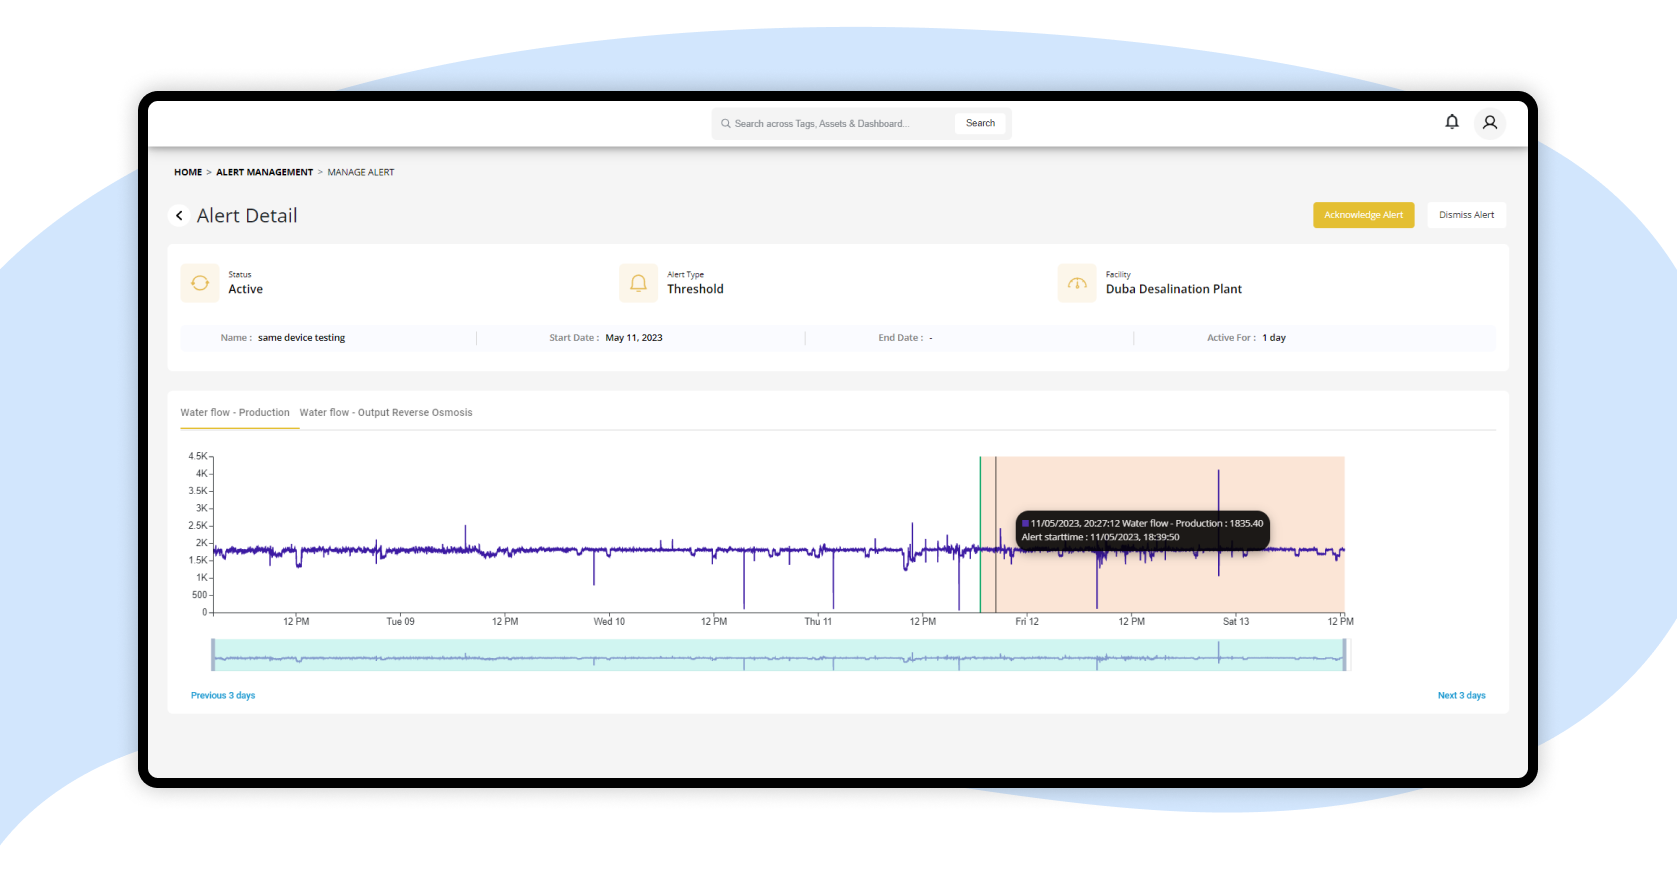
Real-Time Dashboards: Developed real-time dashboards that provide instant insights, making it easier for users to monitor and control various aspects of the city.
Data Prioritization: Incorporated data prioritization algorithms to focus on critical data points, reducing clutter and ensuring that important trends are easily identifiable.
2. Predictive Maintenance and Anomaly Detection:
Proprietary AI Algorithms: Integrated 25+ proprietary AI-based algorithms for IoT data anomaly detection, enabling real-time analysis and alert generation using computer vision and other visual data sources.
Preemptive Maintenance: Developed preemptive maintenance scheduling with automated data monitoring, ensuring that potential issues are addressed before they escalate.
Continuous Data Validation: Implemented continuous real-time data validation against system-generated sensor, device, and network fingerprinting to maintain data accuracy.
3. Scalable and User-Centric Design:
Scalable Infrastructure: Ensured the platform’s infrastructure is scalable to handle the growing data needs as Neom expands, providing consistent performance across all sectors.
User-Friendly Interfaces: Created user-friendly interfaces with intuitive visualization features, allowing both technical and non-technical users to easily interact with the platform and gain insights.
4. Sector-Specific Applications:
Versatility Across Sectors: The platform is designed to be versatile and applicable across multiple sectors, including Education, Energy, Entertainment and Culture, Financial Services, Food, Health, Well-Being and Biotech, Manufacturing, Media, Mobility, Sport, Technology and Digital, Tourism, and Water.


Results
Enhanced City Management: Neom IOT SENSE has provided Neom with a powerful tool for managing its vast network of IoT devices, ensuring real-time monitoring, anomaly detection, and predictive maintenance.
Improved Data Interpretation: The advanced data visualization tools and real-time dashboards have improved data interpretation, enabling quicker and more informed decision-making.
Scalable Growth: The scalable infrastructure ensures that the platform can grow alongside Neom, accommodating the increasing volume of data without compromising performance.
User Satisfaction: The intuitive user interfaces and sector-specific applications have led to high user satisfaction, making it easier for residents and administrators to interact with and benefit from the platform.
Technology Stack
-


Frontend
-

Backend
-

Database
-

Cloud & Deployment
-

Real-Time Features